Walmart 3P Data Source – Data Architecture & Profiling Memo
Audience: LMNT Leadership, Analytics, Engineering
Source: Emerson/Walmart 3P Dataset (LMNT_425 schema)
Date: December 2025
1. Executive Summary
What This Is
Emerson Healthcare serves as LMNT’s data provider for Walmart retail performance. They aggregate Walmart’s 3P (third-party seller) data and make it available through a Snowflake Private Share, giving LMNT access to:
- 26 LMNT product SKUs in Walmart’s catalog
- 4,577 stores with active POS sales
- ~$56M in combined revenue (POS + Digital) from March–December 2025
- 3.35M+ units sold across brick-and-mortar and omnichannel
- Distribution center logistics, store traits, and merchandising attributes
This is one of LMNT’s most comprehensive retail datasets, offering store-level sales visibility and omnichannel performance tracking that isn’t typically available from retailers.
Why This Matters Now
-
Walmart is a Major Revenue Channel
With ~$56M in 9 months, Walmart represents a significant portion of LMNT’s retail business. This data enables analysis that’s impossible with aggregated reporting. -
Expansion Opportunity
LMNT is in 4,577 of Walmart’s 6,192 stores (74% penetration). That’s 1,600+ stores where LMNT could expand. -
Emerson Relationship is Evolving
Based on recent discussions, LMNT may be transitioning administrative responsibilities away from Emerson. Understanding what data we get, how we get it, and what alternatives exist is critical for continuity. -
Store-Level Insights are Rare
Most retailers provide aggregated reporting. This dataset enables:- Geographic performance analysis (which states/stores drive revenue)
- Store segmentation (format, traits, demographics)
- Inventory and distribution diagnostics
- Digital vs. in-store channel analysis
Key Findings
✅ Strong Distribution: LMNT is in 74% of Walmart stores nationwide
✅ Balanced Channels: POS (26.6M) are nearly equal
✅ Recent Launch: All items created Dec 2024–Jul 2025 (launch phase data)
✅ 9 Non-Selling SKUs: 26 items in catalog, only 17 actively selling
⚠️ State Concentration: Top 5 states account for majority of revenue
⚠️ Data Dependency: Currently reliant on Emerson’s Snowflake share
What You’ll Find in This Memo
- Section 2: Table-by-table profiling with business interpretation
- Section 3: Cross-table insights (distribution, assortment, sales performance)
- Section 4: Deep-dive business analysis (state performance, Target comparison)
- Section 5: Recommendations and next steps
2. Understanding the Emerson Data Relationship
How LMNT Gets Walmart Data Today
Emerson Healthcare acts as an intermediary between LMNT and Walmart:
- Walmart provides 3P seller data through their Luminate platform
- Emerson ingests this data into their Snowflake environment
- LMNT accesses the data via Snowflake Private Share (zero-ETL replication)
What is Snowflake Private Share?
This is a unique Snowflake feature where data is shared directly between Snowflake accounts without copying or ETL:
- No data movement: Tables appear in LMNT’s Snowflake as if they’re native
- No latency: Updates from Emerson are instant
- No ETL cost: No rows are counted/charged for ingestion
- Governance: Emerson controls access; LMNT has read-only permissions
Key Implication: This is why we recommended Snowflake as a warehouse option in the ETL assessment—Private Share is a significant advantage for this data source.
What Happens if LMNT Moves Away from Emerson?
Based on recent discussions, LMNT may transition administrative responsibilities. Here’s what we need to understand:
Questions to Answer with Phil/Team:
- Will LMNT still have access to Walmart data through Emerson’s Snowflake share?
- Does LMNT have direct access to Walmart Luminate, or is Emerson required?
- If we lose Emerson access, what are the alternatives?
- Direct Walmart Luminate API integration (via Fivetran/Polytomic)
- Another 3P data aggregator
- Build custom ingestion
Risk Assessment:
- Low Risk: Emerson continues data sharing even if administrative relationship changes
- Medium Risk: Need to build Walmart Luminate connector (Fivetran/Polytomic supported)
- High Risk: Lose historical data access (need to export/backup now)
Recommendation: We should export critical historical data to LMNT-owned storage as a backup, regardless of relationship continuity.
3. Table-Level Documentation & Profiling
Each section includes:
- Metrics Summary Table
- Business Description
- Profiling Interpretation
All results reflect the actual queries you’ve executed.
3.1 WALMART_ITEM_ATTRIBUTES
Summary Metrics
| Metric | Value |
|---|---|
| Total Rows | 26 |
Distinct Items (WM_ITEM_NBR) | 26 |
Distinct UPCs (WM_UPC_NBR) | 16 |
Distinct Vendors (VENDOR_NBR) | 1 |
| Item Creation Date Range | 2024-12-16 → 2025-07-11 |
Business Description
Master catalog of Walmart items sold by LMNT.
Contains detailed product attributes including vendor data, UPCs, packaging dimensions, logistics flags, merchandising text, and lifecycle dates.
Interpretation
- Full catalog includes 26 LMNT items
- Only 16 unique UPCs, indicating pack variations or cross-linked UPCs
- Single vendor present (
EMERSON HEALTHCARE LLC) - Items are newly launched between late 2024 and mid 2025
3.2 WALMART_STORESALES
Summary Metrics
| Metric | Value |
|---|---|
| Total Rows | 2,257,319 |
| Distinct Stores | 4,577 |
| Distinct Items Sold | 17 |
| Total Units Sold | 3,352,022 |
| Total Sales | $29,435,812.51 |
| Date Range | 2025-03-05 → 2025-12-01 |
Business Description
Store-level POS transactions capturing sales amount, units, item identifiers, store identifiers, and Walmart fiscal attributes.
Interpretation
- LMNT sells in ~4,600 stores nationwide
- 17 items actively selling in brick-and-mortar
- Strong sales velocity with over 3.35M units and $29.4M in POS revenue
- Dataset covers ~9 months of sales (aligned with program launch)
3.3 WALMART_OMNISALES
Summary Metrics
| Metric | Value |
|---|---|
| Total Rows | 8,251 |
| Distinct Items | 17 |
| Distinct Service Channels | 5 |
| Distinct Order Channels | 2 |
| Total GMV | $26,625,400.03 |
| Total Net Sales | $26,625,400.03 |
| Date Range | 2025-03-05 → 2025-12-01 |
Business Description
Daily ecommerce and omnichannel sales, including GMV, net sales, units, and service/order channel breakdowns.
Interpretation
- Digital sales nearly match POS with $26.6M GMV
- Same 17 items active online and in-store → unified assortment strategy
- Coverage across 5 service channels indicates deep digital penetration
- Time range matches POS, confirming consistent ingestion
3.4 WALMART_STOREITEM
Summary Metrics
| Metric | Value |
|---|---|
| Total Rows | 5,516,563 |
| Distinct Stores | 4,584 |
| Distinct Items | 16 |
Business Description
Store–item mapping table showing item availability, stocking flags, and merchandising attributes for each store.
Interpretation
- LMNT items appear in ~4,584 stores, matching POS distribution
- 16 unique items in availability mapping (vs. 17 selling)
- Used for availability, distribution voids, and replenishment diagnostics
3.5 WALMART_STORETRAIT
Summary Metrics
| Metric | Value |
|---|---|
| Total Trait Records | 30,954,234 |
| Distinct Stores | 4,956 |
Business Description
Store trait assignments describing operational, geographic, service, and format characteristics for Walmart stores.
Interpretation
- Coverage exceeds LMNT’s selling footprint (~4,580 stores)
- Useful for segmentation, modeling, and identifying expansion opportunities
- High record volume reflects many-to-many trait assignments
3.6 WALMART_STOREDIMENSIONS
Summary Metrics
| Metric | Value |
|---|---|
| Total Stores | 6,192 |
| Distinct STORE_NBR | 6,192 |
Business Description
Walmart’s complete store master with location, format, region, and operational attributes.
Interpretation
- LMNT distributes to ~4,580 of Walmart’s 6,192 stores
- Remaining ~1,600 stores represent expansion potential
- Essential for accurate store segmentation and geographic rollups
3.7 WALMART_DCITEMS
Summary Metrics
| Metric | Value |
|---|---|
| Total DC-Item Records | 219,253 |
| Distinct WM Items | 26 |
| Distinct DCs | 47 |
Business Description
Distribution center inventory dataset detailing vendor pack quantities, wholesale pack quantities, costs, shipping/receiving activity, and DC-level coverage.
Interpretation
- All 26 LMNT catalog items appear in the DC network
- 47 distribution centers → strong national supply chain coverage
- Supports DC operations, replenishment modeling, and inventory analytics
3.8 WALMART_CALENDAR
Summary Metrics
| Metric | Value |
|---|---|
| Total Calendar Records | 21,553 |
| Date Range | 1990-12-29 → 2049-12-31 |
Business Description
Walmart’s full fiscal, retail, and Gregorian calendar mapping, including LY/YOY comparison fields.
Interpretation
- Covers 60 years of dates, enabling long-term YOY analysis
- Required for aligning sales to Walmart fiscal periods
- Supports forecasting models and future-year dashboards
4. Cross-Table Insights & Strategic Observations
This section synthesizes findings across all tables to answer key business questions.
4.1 Distribution Footprint Analysis
Distribution Footprint
| Table | Stores |
|---|---|
Total Walmart Fleet (STOREDIMENSIONS) | 6,192 |
Stores with Traits (STORETRAIT) | 4,956 |
| Stores with Store-Item Mapping | 4,584 |
| Stores with POS Sales | 4,577 |
LMNT distribution is strong (~74% of the Walmart fleet).
1,600+ expansion opportunities exist.
Assortment Coverage
| Metric | Value |
|---|---|
| Total Catalog Items | 26 |
| Items with Store Sales | 17 |
| Items with Digital Sales | 17 |
| Items in DC Supply Chain | 26 |
Digital and POS assortments match closely.
Full supply chain integration exists for all 26 items.
Sales Performance Overview
| Channel | Revenue |
|---|---|
| POS | $29.4M |
| Digital | $26.6M |
| Combined | ~$56M |
LMNT is performing strongly across both channels.
Analysis - Walmart
1. We identified nine items in the catalog for which no sales transactions exist.
| WM_ITEM_NBR | MDS_FAM_ID | CATLG_ITEM_ID | OP_CMPNY_CD | VENDOR_NBR | ACCTG_DEPT_NBR | ITEM_STATUS_CD | ITEM_NAME | FINELINE_DESC | ITEM_CREATE_DT | OBSOLETE_DT | ITEM_TYPE_CD | WM_UPC_NBR | WM_UPC_DESC | ITEM_TYPE_DESC | ALL_LINKS_ITEM_DESC_1 | ALL_LINKS_ITEM_NBR | ALL_LINKS_MDS_FAM_ID | BASE_UNIT_RTL_AMT | NEVER_OUT_IND | WHSE_MIN_ORDER_QTY | PALLET_HI_QTY | PALLET_UPC_NBR | WHPK_QTY | WHSE_ALGN_TYPE_DESC | WHPK_LEN_QTY | WHPK_WDTH_QTY | WHPK_CUBE_QTY | WHPK_HT_QTY | VENDOR_DEPT_NBR | VNDR_MIN_ORDER_QTY | VNPK_QTY | VNPK_WT_QTY | VNPK_LEN_QTY | VNPK_WDTH_QTY | VNPK_HT_QTY | VENDOR_SEQ_NBR | OMNI_SEG_NBR | OMNI_SEG_DESC | OMNI_DEPT_NBR | OMNI_DEPT_DESC | OMNI_CATG_NBR | OMNI_CATG_DESC | OMNI_CATG_GRP_NBR | OMNI_CATG_GRP_DESC | OMNI_SUBCATG_NBR | OMNI_SUBCATG_DESC | VENDOR_STOCK_ID | VENDOR_NM | BRAND_OWNR_NM | BRAND_NM | BRAND_ID | BRAND_FAM_NM | BRAND_FAM_ID | BRAND_OWNR_ID | VNPK_COST_AMT | WHPK_UNIT_COST | ITEM_DESC_2 | COLOR_DESC | SIZE_DESC | REPL_SUBTYPE_CD | REPL_SUBTYPE_DESC | ITEM_LEN_QTY | ITEM_HT_QTY | ITEM_WDTH_QTY | ITEM_CUBE_QTY | ITEM_CUBE_UOM_CD | ITEM_CUBE_UOM_DESC | ITEM_ORDER_EFF_DT | SELL_QTY | SELL_UOM_CD | SELL_UOM_DESC | PALLET_TI_QTY | VNPK_CUBE_QTY | VNPK_CUBE_UOM_CD | VNPK_CUBE_UOM_DESC | VNPK_CSPK_CD | VNPK_CSPK_DESC | WHPK_UPC_NBR | WHPK_WT_QTY | WHPK_WT_UOM_CD | WHPK_WT_UOM_DESC | ORDER_SIZNG_FCTR_QTY | REPL_UNIT_IND | REPL_GROUP_NBR | FINELINE_NBR | GEO_REGION_CD | BASE_DIV_NBR | BUYR_RPT_POSTN_ID | WHPK_CALC_MTHD_DESC | PLNR_RPT_POSTN_ID | ACCTG_DEPT_DESC | CNTRY_NM | ITEM_STATUS_DESC | PRIME_XREF_ITEM_NBR | PRIME_XREF_MDS_FAM_ID | PRIME_LIA_ITEM_NBR | PRIME_LIA_MDS_FAM_ID | WHSE_ALGN_TYPE_CD | WHSE_AREA_CD | WHSE_AREA_DESC | WHSE_ROTATION_CD | WHSE_ROTATION_DESC | WHPK_CALC_MTHD_CD | WHPK_SELL_AMT | PLU_NBR | CONS_ITEM_NBR | CONS_ITEM_DESC | PROD_NBR | PROD_DESC | CUST_BASE_RTL_AMT | BASE_RTL_UOM_CD | BASE_RTL_UOM_DESC | CNCL_WHEN_OUT_IND | ITEM_IMPORT_IND | ITEM_REPL_IND | GUAR_SALES_IND | MASTER_CARTON_IND | VNPK_WT_UOM_CD | VNPK_WT_UOM_DESC | VNPK_DIM_UOM_CD | VNPK_DIM_UOM_DESC | WHSE_MAX_ORDER_QTY | WHPK_CUBE_UOM_CD | WHPK_CUBE_UOM_DESC | WHPK_DIM_UOM_CD | WHPK_DIM_UOM_DESC | BUYG_REGION_CD | BUYG_REGION_DESC | SHOP_DESC | SIGNING_DESC | ASORT_TYPE_CD | ASORT_TYPE_DESC | SEASN_CD | SEASN_DESC | SEASN_YR | ITEM_DIM_UOM_CD | ITEM_DIM_UOM_DESC | ITEM_WT_QTY | ITEM_WT_UOM_CD | ITEM_WT_UOM_DESC | ITEM_EXPIRE_DT | EST_OUT_OF_STOCK_DT | PALLET_SIZE_CD | PALLET_RND_PCT | CASE_UPC_NBR | VNPK_WT_FMT_CD | VNPK_WT_FMT_DESC | VNPK_NET_WT_QTY | VNPK_NET_WT_UOM_CD | MODLR_BASE_MDSE_CD | MODLR_BASE_MDSE_DESC | ITEM_STATUS_CHNG_DT | ITEM_COST_AMT | ACCT_NBR | ACCT_NBR_TYPE_CD | ACCT_NBR_TYPE_DESC | ACTV_CD | ACTV_DESC | ALCOHOL_PCT | ALT_CHNL_SRC_IND | BACKRM_SCALE_IND | CANNED_ORDER_IND | CASE_UPC_FMT_CD | CASE_UPC_FMT_DESC | CATCH_WT_IND | CNSUMABLE_DIV_NBR | CNTRL_SUBSTANCE_IND | COMMODITY_ID | CONVEY_IND | CRUSH_FCTR_CD | CRUSH_FCTR_DESC | DC_DEA_RPT_IND | DEST_CD | DEST_DESC | DIET_TYPE_CD | DIET_TYPE_DESC | ASSOC_DISC_IND | FHS_DC_SLOT_CD | FHS_DC_SLOT_DESC | FSA_IND | GIFT_CARD_FACE_AMT | GIFT_CARD_FEE_AMT | GIFT_CARD_FEE_PCT | GIFT_CARD_TYPE_CD | GIFT_CARD_TYPE_DESC | IDEAL_TEMPR_HI_QTY | IDEAL_TEMPR_LOW_QTY | INFRM_REORD_TYPE_CD | INFRM_REORD_TYPE_DESC | ITEM_SCANNABLE_IND | ITEM_SYNC_STATUS_CD | ITEM_SYNC_STATUS_DESC | ITEMFILE_SRC_NM | LAST_ORDER_DT | LIC_CD | LIC_DESC | MDSE_PGM_ID | MFGR_PRE_PRICE_AMT | MFGR_SUGD_RTL_AMT | MIN_PRICE_IND | MIN_RCVNG_DAYS_QTY | MIN_WHSE_LIFE_QTY | NON_MBR_UPCHRG_IND | OSA_SUPPLIER_ID | PALLET_UPC_FMT_CD | PALLET_UPC_FMT_DESC | PERFM_RATG_CD | PERFM_RATG_DESC | PRICE_COMP_QTY | PRICE_COMP_UOM_CD | PRIME_UPC_ITEM_NBR | PRIME_UPC_MDS_FAM_ID | PROJ_YR_SALE_QTY | PROMO_ORDER_BOOK_CD | PROMO_ORDER_BOOK_DESC | PRMPT_PRICE_IND | QLTY_CNTRL_CD | QLTY_CNTRL_DESC | RSRV_MDSE_CD | RSRV_MDSE_DESC | RSRV_MDSE_IND | RTL_INCL_VAT_IND | RTN_RESALE_IND | RFID_IND | RPPC_IND | RTL_NOTIF_STORE_IND | SECUR_TAG_IND | SEGREGATION_CD | SEGREGATION_DESC | SEND_STORE_DT | SHELF_LBL_REQMT_IND | SHELF_ROTATION_IND | SHELF_LIFE_DYS_QTY | SUPPLIER_DISP_IND | TEMPR_SENSITIVE_IND | TEMPR_UOM_CD | UPC_FMT_CD | UPC_FMT_DESC | VAR_COMP_IND | VAR_WT_IND | VNDR_FIRST_ORDER_DT | VNDR_FIRST_SHIP_DT | VNDR_FIRST_AVLBL_DT | VNDR_INCRM_ORDER_QTY | VNDR_LAST_SHIP_DT | VNDR_LD_TM_QTY | VNDR_MIN_ORDER_UOM_CD | WHPK_NET_WT_QTY | WHPK_UPC_FMT_CD | WHPK_UPC_FMT_DESC | PVT_LBL_IND | GTIN | BUYER_USERID | BUYER_FULL_NM | ITEM_SHARE_IND | ITEM_SHARE_COST_IND | LOADDATE | FUTURE_EFFECTIVE_DATE |
|---|---|---|---|---|---|---|---|---|---|---|---|---|---|---|---|---|---|---|---|---|---|---|---|---|---|---|---|---|---|---|---|---|---|---|---|---|---|---|---|---|---|---|---|---|---|---|---|---|---|---|---|---|---|---|---|---|---|---|---|---|---|---|---|---|---|---|---|---|---|---|---|---|---|---|---|---|---|---|---|---|---|---|---|---|---|---|---|---|---|---|---|---|---|---|---|---|---|---|---|---|---|---|---|---|---|---|---|---|---|---|---|---|---|---|---|---|---|---|---|---|---|---|---|---|---|---|---|---|---|---|---|---|---|---|---|---|---|---|---|---|---|---|---|---|---|---|---|---|---|---|---|---|---|---|---|---|---|---|---|---|---|---|---|---|---|---|---|---|---|---|---|---|---|---|---|---|---|---|---|---|---|---|---|---|---|---|---|---|---|---|---|---|---|---|---|---|---|---|---|---|---|---|---|---|---|---|---|---|---|---|---|---|---|---|---|---|---|---|---|---|---|---|---|---|---|---|---|---|---|---|---|---|---|---|---|---|---|---|---|---|---|---|---|---|---|---|---|---|---|---|---|---|---|---|---|---|---|---|
| 674256828 | 385564625 | 14735171608 | WMT-US | 657644 | 95 | D | LMNT ZS 4 GRF S 16OZ | CULTURE POP SINGLES | 2024-12-16 | 2025-05-13 | 20 | 81018349038 | LMNT | Warehouse | LMNT ZS 4 GRF S 16OZ | 674256828 | 385564625 | 12 | 0 | 0 | 7 | 6 | ASSEMBLY | 12 | 16 | 1 | 7 | 95 | 6 | 27 | 12 | 16 | 7 | 0 | 80000 | FOOD | 95 | SNACKS AND BEVERAGES | 12104 | MODERN SODA | 819 | MODERN SODA AND RTD COFFEE | 31119 | MODERN SODA SINGLES | MCSGFT6X0416 | EMERSON HEALTHCARE LLC | DRINK LMNT, INC. | LMNT | 610908 | LMNT | 204202 | 202549 | 54 | 54 | NA | 16OZ | 0 | WR - WAREHOUSE REGULAR ITEM | 5 | 6 | 5 | 0 | CF | Cubic Foot | 2024-12-17 | 16 | EA | Each | 10 | 1 | CF | Cubic Foot | C | CASEPACK | 1081018349038 | 27 | LB | Pound | 0 | 222791963 | 4718 | US | 1 | 1281830 | AVERAGED | 1266896 | SNACKS & BEVERAGES | United States | DELETE | 674256828 | 385564625 | 674256828 | 385564625 | AS | 6 | Dry Grocery | 3 | Strict - By Sell By Date | A | 54 | 286157329 | LMNT ZS 4 GRF S 16OZ | 286157330 | LMNT ZS 4 GRF S 16OZ | 12 | EA | Each | 0 | 0 | 0 | 0 | 0 | LB | Pound | IN | Inch | CF | Cubic Foot | IN | Inch | UNKNOWN | LMNT ZERO-SUGAR 4PK GRAPFT SALT 16OZ | 0 | Basic | 2024 | IN | Inch | 5 | LB | Pound | 2049-12-31 | L | 1 | 1081018349038 | F | FIXED WEIGHT | LB | H | HOLD | 2025-02-07 | 9 | N | NO | 0 | 0 | 0 | 3 | EAN - 13 | 0 | 0 | 100 | 1 | 1 | STRONGEST | 0 | 2 | WAL-MART AND SUPERCENTERS | 1 | 0 | 1 | GOLD | 0 | 45 | 0 | 135286 | 2 | More Important | 674256828 | 385564625 | 0 | 0 | NONE | 0 | 0 | 0 | 0 | 0 | 1 | 0 | 1 | GENERAL HANDLING | 2024-12-17 | 1 | 1 | 730 | 0 | 0 | FA | 2 | UPC - 12 | 0 | 0 | 2024-12-16 | 0 | 00810183490389 | homeoffice\n0s063m | Nick Scutari-Dunn | N | Y | 2025-12-10 18:01:17.778 | ||||||||||||||||||||||||||||||||||||||||||||||||||||||||||
| 674255061 | 385562858 | 14740100732 | WMT-US | 657644 | 95 | D | LMNT ZS ORNG ST 6CT | BASIC OTG STICKS | 2024-12-16 | 2025-05-13 | 20 | 81018349027 | LMNT | Warehouse | LMNT ZS ORNG ST 6CT | 674255061 | 385562858 | 9 | 0 | 0 | 7 | 8 | ASSEMBLY | 8 | 7 | 0 | 7 | 95 | 8 | 1 | 8 | 7 | 7 | 0 | 80000 | FOOD | 95 | SNACKS AND BEVERAGES | 8546 | POWDERED SOFT DRINKS | 6744 | PSD | 19128 | PSD STICKS | MCORA8X0601 | EMERSON HEALTHCARE LLC | DRINK LMNT, INC. | LMNT | 610908 | LMNT | 204202 | 202549 | 54 | 54 | NA | 6CT | 0 | WR - WAREHOUSE REGULAR ITEM | 2 | 6 | 4 | 0 | CF | Cubic Foot | 2024-12-17 | 6 | EA | Each | 35 | 0 | CF | Cubic Foot | C | CASEPACK | 2081018349027 | 1 | LB | Pound | 0 | 222790298 | 4631 | US | 1 | 1288488 | AVERAGED | 1263218 | SNACKS & BEVERAGES | United States | DELETE | 674255061 | 385562858 | 674255061 | 385562858 | AS | 6 | Dry Grocery | 3 | Strict - By Sell By Date | A | 54 | 286153927 | LMNT ZS ORNG ST 6CT | 286153937 | LMNT ZS ORNG ST 6CT | 9 | EA | Each | 0 | 0 | 0 | 0 | 0 | LB | Pound | IN | Inch | CF | Cubic Foot | IN | Inch | UNKNOWN | LMNT ZERO-SUGAR ORANGE SALT 6CT | 0 | Basic | 2024 | IN | Inch | 0 | LB | Pound | 2049-12-31 | L | 1 | 2081018349027 | F | FIXED WEIGHT | LB | H | HOLD | 2025-02-07 | 7 | N | NO | 0 | 0 | 0 | 3 | EAN - 13 | 0 | 0 | 100 | 1 | 1 | STRONGEST | 0 | 2 | WAL-MART AND SUPERCENTERS | 1 | 0 | 1 | GOLD | 0 | 45 | 0 | 135286 | 2 | More Important | 674255061 | 385562858 | 0 | 0 | NONE | 0 | 0 | 0 | 0 | 0 | 1 | 0 | 1 | GENERAL HANDLING | 2024-12-17 | 1 | 1 | 730 | 0 | 0 | FA | 2 | UPC - 12 | 0 | 0 | 2024-12-16 | 0 | 00810183490273 | homeoffice\s0l057u | Steven Litwiller | N | Y | 2025-12-10 18:01:17.778 | ||||||||||||||||||||||||||||||||||||||||||||||||||||||||||
| 674255064 | 385562861 | 14703166837 | WMT-US | 657644 | 95 | D | LMNT ZS RASBY ST 6CT | BASIC OTG STICKS | 2024-12-16 | 2025-05-13 | 20 | 81018349028 | LMNT | Warehouse | LMNT ZS RASBY ST 6CT | 674255064 | 385562861 | 9 | 0 | 0 | 7 | 8 | ASSEMBLY | 8 | 7 | 0 | 7 | 95 | 8 | 1 | 8 | 7 | 7 | 0 | 80000 | FOOD | 95 | SNACKS AND BEVERAGES | 8546 | POWDERED SOFT DRINKS | 6744 | PSD | 19128 | PSD STICKS | MCRAS8X0601 | EMERSON HEALTHCARE LLC | DRINK LMNT, INC. | LMNT | 610908 | LMNT | 204202 | 202549 | 54 | 54 | NA | 6CT | 0 | WR - WAREHOUSE REGULAR ITEM | 2 | 6 | 4 | 0 | CF | Cubic Foot | 2024-12-17 | 6 | EA | Each | 35 | 0 | CF | Cubic Foot | C | CASEPACK | 2081018349028 | 1 | LB | Pound | 0 | 222790301 | 4631 | US | 1 | 1288488 | AVERAGED | 1263218 | SNACKS & BEVERAGES | United States | DELETE | 674255064 | 385562861 | 674255064 | 385562861 | AS | 6 | Dry Grocery | 3 | Strict - By Sell By Date | A | 54 | 286153934 | LMNT ZS RASBY ST 6CT | 286153939 | LMNT ZS RASBY ST 6CT | 9 | EA | Each | 0 | 0 | 0 | 0 | 0 | LB | Pound | IN | Inch | CF | Cubic Foot | IN | Inch | UNKNOWN | LMNT ZERO-SUGAR RASBERRY SALT 6CT | 0 | Basic | 2024 | IN | Inch | 0 | LB | Pound | 2049-12-31 | L | 1 | 2081018349028 | F | FIXED WEIGHT | LB | H | HOLD | 2025-02-07 | 7 | Y | YES | 0 | 0 | 0 | 3 | EAN - 13 | 0 | 0 | 100 | 1 | 1 | STRONGEST | 0 | 2 | WAL-MART AND SUPERCENTERS | 1 | 0 | 1 | GOLD | 0 | 45 | 0 | 135286 | 2 | More Important | 674255064 | 385562861 | 0 | 0 | NONE | 0 | 0 | 0 | 0 | 0 | 1 | 0 | 1 | GENERAL HANDLING | 2024-12-17 | 1 | 1 | 730 | 0 | 0 | FA | 2 | UPC - 12 | 0 | 0 | 2024-12-16 | 0 | 00810183490280 | homeoffice\s0l057u | Steven Litwiller | N | Y | 2025-12-10 18:01:17.778 | ||||||||||||||||||||||||||||||||||||||||||||||||||||||||||
| 674256757 | 385564554 | 14740809188 | WMT-US | 657644 | 95 | D | LMNT ZS 1 CTR S 16OZ | CULTURE POP SINGLES | 2024-12-16 | 2025-05-13 | 20 | 85005599310 | LMNT | Warehouse | LMNT ZS 1 CTR S 16OZ | 674256757 | 385564554 | 3 | 0 | 0 | 7 | 24 | ASSEMBLY | 12 | 16 | 1 | 7 | 95 | 24 | 27 | 12 | 16 | 7 | 0 | 80000 | FOOD | 95 | SNACKS AND BEVERAGES | 1534 | SPORTS DRINKS | 5819 | SPORTS AND ENERGY DRINKS | 19156 | SINGLES ISOTONICS | MCSCIT24X116 | EMERSON HEALTHCARE LLC | DRINK LMNT, INC. | LMNT | 610908 | LMNT | 204202 | 202549 | 48 | 48 | NA | 16OZ | 0 | WR - WAREHOUSE REGULAR ITEM | 3 | 6 | 3 | 0 | CF | Cubic Foot | 2024-12-17 | 16 | EA | Each | 10 | 1 | CF | Cubic Foot | C | CASEPACK | 1085005599310 | 27 | LB | Pound | 0 | 222791917 | 4718 | US | 1 | 1281830 | AVERAGED | 1266896 | SNACKS & BEVERAGES | United States | DELETE | 674256757 | 385564554 | 674256757 | 385564554 | AS | 6 | Dry Grocery | 3 | Strict - By Sell By Date | A | 59 | 286157173 | LMNT ZS 1 CTR S 16OZ | 286157180 | LMNT ZS 1 CTR S 16OZ | 3 | EA | Each | 0 | 0 | 0 | 0 | 0 | LB | Pound | IN | Inch | CF | Cubic Foot | IN | Inch | UNKNOWN | LMNT ZERO-SUGAR SNGL CITRUS SALT 16OZ | 0 | Basic | 2024 | IN | Inch | 1 | LB | Pound | 2049-12-31 | L | 1 | 1085005599310 | F | FIXED WEIGHT | LB | H | HOLD | 2025-02-07 | 2 | Y | YES | 0 | 0 | 0 | 3 | EAN - 13 | 0 | 0 | 100 | 1 | 1 | STRONGEST | 0 | 2 | WAL-MART AND SUPERCENTERS | 1 | 0 | 1 | GOLD | 0 | 45 | 0 | 135286 | 2 | More Important | 674256757 | 385564554 | 0 | 0 | NONE | 0 | 0 | 0 | 0 | 0 | 1 | 0 | 1 | GENERAL HANDLING | 2024-12-17 | 1 | 1 | 730 | 0 | 0 | FA | 2 | UPC - 12 | 0 | 0 | 2024-12-16 | 0 | 00850055993105 | homeoffice\banglea | Britney Anglea | N | Y | 2025-12-10 18:01:17.778 | ||||||||||||||||||||||||||||||||||||||||||||||||||||||||||
| 674256755 | 385564552 | 14753013437 | WMT-US | 657644 | 95 | D | LMNT ZS 4 BC LM 16OZ | CULTURE POP SINGLES | 2024-12-16 | 2025-05-13 | 20 | 81018349035 | LMNT | Warehouse | LMNT ZS 4 BC LM 16OZ | 674256755 | 385564552 | 12 | 0 | 0 | 7 | 6 | ASSEMBLY | 12 | 16 | 1 | 7 | 95 | 6 | 27 | 12 | 16 | 7 | 0 | 80000 | FOOD | 95 | SNACKS AND BEVERAGES | 12104 | MODERN SODA | 819 | MODERN SODA AND RTD COFFEE | 31119 | MODERN SODA SINGLES | MCSBCL6X0416 | EMERSON HEALTHCARE LLC | DRINK LMNT, INC. | LMNT | 610908 | LMNT | 204202 | 202549 | 54 | 54 | NA | 16OZ | 0 | WR - WAREHOUSE REGULAR ITEM | 5 | 6 | 5 | 0 | CF | Cubic Foot | 2024-12-17 | 16 | EA | Each | 10 | 1 | CF | Cubic Foot | C | CASEPACK | 1081018349035 | 27 | LB | Pound | 0 | 222791915 | 4718 | US | 1 | 1281830 | AVERAGED | 1266896 | SNACKS & BEVERAGES | United States | DELETE | 674256755 | 385564552 | 674256755 | 385564552 | AS | 6 | Dry Grocery | 3 | Strict - By Sell By Date | A | 54 | 286157167 | LMNT ZS 4 BC LM 16OZ | 286157176 | LMNT ZS 4 BC LM 16OZ | 12 | EA | Each | 0 | 0 | 0 | 0 | 0 | LB | Pound | IN | Inch | CF | Cubic Foot | IN | Inch | UNKNOWN | LMNT ZERO-SUGAR 4PK BLCK CHRRY LME 16OZ | 0 | Basic | 2024 | IN | Inch | 5 | LB | Pound | 2049-12-31 | L | 1 | 1081018349035 | F | FIXED WEIGHT | LB | H | HOLD | 2025-02-07 | 9 | N | NO | 0 | 0 | 0 | 3 | EAN - 13 | 0 | 0 | 100 | 1 | 1 | STRONGEST | 0 | 2 | WAL-MART AND SUPERCENTERS | 1 | 0 | 1 | GOLD | 0 | 45 | 0 | 135286 | 2 | More Important | 674256755 | 385564552 | 0 | 0 | NONE | 0 | 0 | 0 | 0 | 0 | 1 | 0 | 1 | GENERAL HANDLING | 2024-12-17 | 1 | 1 | 730 | 0 | 0 | FA | 2 | UPC - 12 | 0 | 0 | 2024-12-16 | 0 | 00810183490358 | homeoffice\n0s063m | Nick Scutari-Dunn | N | Y | 2025-12-10 18:01:17.778 | ||||||||||||||||||||||||||||||||||||||||||||||||||||||||||
| 674256760 | 385564557 | 14749254219 | WMT-US | 657644 | 95 | D | LMNT ZS 4 CTR S 16OZ | CULTURE POP SINGLES | 2024-12-16 | 2025-05-13 | 20 | 81018349036 | LMNT | Warehouse | LMNT ZS 4 CTR S 16OZ | 674256760 | 385564557 | 12 | 0 | 0 | 7 | 6 | ASSEMBLY | 12 | 16 | 1 | 7 | 95 | 6 | 27 | 12 | 16 | 7 | 0 | 80000 | FOOD | 95 | SNACKS AND BEVERAGES | 12104 | MODERN SODA | 819 | MODERN SODA AND RTD COFFEE | 31119 | MODERN SODA SINGLES | MCSCIT6X0416 | EMERSON HEALTHCARE LLC | DRINK LMNT, INC. | LMNT | 610908 | LMNT | 204202 | 202549 | 54 | 54 | NA | 16OZ | 0 | WR - WAREHOUSE REGULAR ITEM | 5 | 6 | 5 | 0 | CF | Cubic Foot | 2024-12-17 | 16 | EA | Each | 10 | 1 | CF | Cubic Foot | C | CASEPACK | 1081018349036 | 27 | LB | Pound | 0 | 222791920 | 4718 | US | 1 | 1281830 | AVERAGED | 1266896 | SNACKS & BEVERAGES | United States | DELETE | 674256760 | 385564557 | 674256760 | 385564557 | AS | 6 | Dry Grocery | 3 | Strict - By Sell By Date | A | 54 | 286157179 | LMNT ZS 4 CTR S 16OZ | 286157183 | LMNT ZS 4 CTR S 16OZ | 12 | EA | Each | 0 | 0 | 0 | 0 | 0 | LB | Pound | IN | Inch | CF | Cubic Foot | IN | Inch | UNKNOWN | LMNT ZERO-SUGAR 4PK CITRUS SALT 16OZ | 0 | Basic | 2024 | IN | Inch | 5 | LB | Pound | 2049-12-31 | L | 1 | 1081018349036 | F | FIXED WEIGHT | LB | H | HOLD | 2025-02-07 | 9 | N | NO | 0 | 0 | 0 | 3 | EAN - 13 | 0 | 0 | 100 | 1 | 1 | STRONGEST | 0 | 2 | WAL-MART AND SUPERCENTERS | 1 | 0 | 1 | GOLD | 0 | 45 | 0 | 135286 | 2 | More Important | 674256760 | 385564557 | 0 | 0 | NONE | 0 | 0 | 0 | 0 | 0 | 1 | 0 | 1 | GENERAL HANDLING | 2024-12-17 | 1 | 1 | 730 | 0 | 0 | FA | 2 | UPC - 12 | 0 | 0 | 2024-12-16 | 0 | 00810183490365 | homeoffice\n0s063m | Nick Scutari-Dunn | N | Y | 2025-12-10 18:01:17.778 | ||||||||||||||||||||||||||||||||||||||||||||||||||||||||||
| 674256756 | 385564553 | 14754302287 | WMT-US | 657644 | 95 | A | LMNT ZS 4 WTR S 16OZ | CULTURE POP SINGLES | 2024-12-16 | 2500-01-01 | 20 | 81018349037 | LMNT | Warehouse | LMNT ZS 4 WTR S 16OZ | 674256756 | 385564553 | 12 | 0 | 0 | 7 | 6 | ASSEMBLY | 12 | 16 | 1 | 7 | 95 | 6 | 27 | 12 | 16 | 7 | 0 | 80000 | FOOD | 95 | SNACKS AND BEVERAGES | 12104 | MODERN SODA | 819 | MODERN SODA AND RTD COFFEE | 31119 | MODERN SODA SINGLES | MCSWTR6X0416 | EMERSON HEALTHCARE LLC | DRINK LMNT, INC. | LMNT | 610908 | LMNT | 204202 | 202549 | 54 | 54 | NA | 16OZ | 0 | WR - WAREHOUSE REGULAR ITEM | 5 | 6 | 5 | 0 | CF | Cubic Foot | 2024-12-17 | 16 | EA | Each | 10 | 1 | CF | Cubic Foot | C | CASEPACK | 1081018349037 | 27 | LB | Pound | 0 | 222791916 | 4718 | US | 1 | 1281830 | AVERAGED | 1266896 | SNACKS & BEVERAGES | United States | ACTIVE | 674256756 | 385564553 | 674256756 | 385564553 | AS | 6 | Dry Grocery | 3 | Strict - By Sell By Date | A | 54 | 286157169 | LMNT ZS 4 WTR S 16OZ | 286157177 | LMNT ZS 4 WTR S 16OZ | 12 | EA | Each | 0 | 0 | 1 | 0 | 0 | LB | Pound | IN | Inch | CF | Cubic Foot | IN | Inch | UNKNOWN | LMNT ZERO-SUGAR 4PK WATERMELON SALT 16OZ | 0 | Basic | 2024 | IN | Inch | 5 | LB | Pound | 2049-12-31 | L | 1 | 1081018349037 | F | FIXED WEIGHT | LB | H | HOLD | 2024-12-16 | 9 | N | NO | 0 | 0 | 0 | 3 | EAN - 13 | 0 | 0 | 100 | 1 | 1 | STRONGEST | 0 | 2 | WAL-MART AND SUPERCENTERS | 1 | 0 | 1 | GOLD | 0 | 45 | 0 | 135286 | 2 | More Important | 674256756 | 385564553 | 0 | 0 | NONE | 0 | 0 | 0 | 0 | 0 | 1 | 0 | 1 | GENERAL HANDLING | 2024-12-17 | 1 | 1 | 730 | 0 | 0 | FA | 2 | UPC - 12 | 0 | 0 | 2024-12-16 | 0 | 00810183490372 | homeoffice\n0s063m | Nick Scutari-Dunn | N | Y | 2025-12-10 18:01:17.778 | ||||||||||||||||||||||||||||||||||||||||||||||||||||||||||
| 674255062 | 385562859 | 14753614186 | WMT-US | 657644 | 95 | D | LMNT ZS CTRS ST 6CT | BASIC OTG STICKS | 2024-12-16 | 2025-05-13 | 20 | 81018349025 | LMNT | Warehouse | LMNT ZS CTRS ST 6CT | 674255062 | 385562859 | 9 | 0 | 0 | 7 | 8 | ASSEMBLY | 8 | 7 | 0 | 7 | 95 | 8 | 1 | 8 | 7 | 7 | 0 | 80000 | FOOD | 95 | SNACKS AND BEVERAGES | 8546 | POWDERED SOFT DRINKS | 6744 | PSD | 19128 | PSD STICKS | MCCIT8X0601 | EMERSON HEALTHCARE LLC | DRINK LMNT, INC. | LMNT | 610908 | LMNT | 204202 | 202549 | 54 | 54 | NA | 6CT | 0 | WR - WAREHOUSE REGULAR ITEM | 2 | 6 | 4 | 0 | CF | Cubic Foot | 2024-12-17 | 6 | EA | Each | 35 | 0 | CF | Cubic Foot | C | CASEPACK | 2081018349025 | 1 | LB | Pound | 0 | 222790299 | 4631 | US | 1 | 1288488 | AVERAGED | 1263218 | SNACKS & BEVERAGES | United States | DELETE | 674255062 | 385562859 | 674255062 | 385562859 | AS | 6 | Dry Grocery | 3 | Strict - By Sell By Date | A | 54 | 286153925 | LMNT ZS CTRS ST 6CT | 286153938 | LMNT ZS CTRS ST 6CT | 9 | EA | Each | 0 | 0 | 0 | 0 | 0 | LB | Pound | IN | Inch | CF | Cubic Foot | IN | Inch | UNKNOWN | LMNT ZERO-SUGAR CITRUS SALT 6CT | 0 | Basic | 2024 | IN | Inch | 0 | LB | Pound | 2049-12-31 | L | 1 | 2081018349025 | F | FIXED WEIGHT | LB | H | HOLD | 2025-02-07 | 7 | Y | YES | 0 | 0 | 0 | 3 | EAN - 13 | 0 | 0 | 100 | 1 | 1 | STRONGEST | 0 | 2 | WAL-MART AND SUPERCENTERS | 1 | 0 | 1 | GOLD | 0 | 45 | 0 | 135286 | 2 | More Important | 674255062 | 385562859 | 0 | 0 | NONE | 0 | 0 | 0 | 0 | 0 | 1 | 0 | 1 | GENERAL HANDLING | 2024-12-17 | 1 | 1 | 730 | 0 | 0 | FA | 2 | UPC - 12 | 0 | 0 | 2024-12-16 | 0 | 00810183490259 | homeoffice\s0l057u | Steven Litwiller | N | Y | 2025-12-10 18:01:17.778 | ||||||||||||||||||||||||||||||||||||||||||||||||||||||||||
| 674255067 | 385562864 | 14740150308 | WMT-US | 657644 | 95 | D | LMNT ZS GRPFT ST 6CT | BASIC OTG STICKS | 2024-12-16 | 2025-05-13 | 20 | 81018349029 | LMNT | Warehouse | LMNT ZS GRPFT ST 6CT | 674255067 | 385562864 | 9 | 0 | 0 | 7 | 8 | ASSEMBLY | 8 | 7 | 0 | 7 | 95 | 8 | 1 | 8 | 7 | 7 | 0 | 80000 | FOOD | 95 | SNACKS AND BEVERAGES | 8546 | POWDERED SOFT DRINKS | 6744 | PSD | 19128 | PSD STICKS | MCGFT8X0601 | EMERSON HEALTHCARE LLC | DRINK LMNT, INC. | LMNT | 610908 | LMNT | 204202 | 202549 | 54 | 54 | NA | 6CT | 0 | WR - WAREHOUSE REGULAR ITEM | 2 | 6 | 4 | 0 | CF | Cubic Foot | 2024-12-17 | 6 | EA | Each | 35 | 0 | CF | Cubic Foot | C | CASEPACK | 2081018349029 | 1 | LB | Pound | 0 | 222790303 | 4631 | US | 1 | 1288488 | AVERAGED | 1263218 | SNACKS & BEVERAGES | United States | DELETE | 674255067 | 385562864 | 674255067 | 385562864 | AS | 6 | Dry Grocery | 3 | Strict - By Sell By Date | A | 54 | 286153936 | LMNT ZS GRPFT ST 6CT | 286153944 | LMNT ZS GRPFT ST 6CT | 9 | EA | Each | 0 | 0 | 0 | 0 | 0 | LB | Pound | IN | Inch | CF | Cubic Foot | IN | Inch | UNKNOWN | LMNT ZERO-SUGAR GRAPEFRUIT SALT 6CT | 0 | Basic | 2024 | IN | Inch | 0 | LB | Pound | 2049-12-31 | L | 1 | 2081018349029 | F | FIXED WEIGHT | LB | H | HOLD | 2025-02-07 | 7 | N | NO | 0 | 0 | 0 | 3 | EAN - 13 | 0 | 0 | 100 | 1 | 1 | STRONGEST | 0 | 2 | WAL-MART AND SUPERCENTERS | 1 | 0 | 1 | GOLD | 0 | 45 | 0 | 135286 | 2 | More Important | 674255067 | 385562864 | 0 | 0 | NONE | 0 | 0 | 0 | 0 | 0 | 1 | 0 | 1 | GENERAL HANDLING | 2024-12-17 | 1 | 1 | 730 | 0 | 0 | FA | 2 | UPC - 12 | 0 | 0 | 2024-12-16 | 0 | 00810183490297 | homeoffice\s0l057u | Steven Litwiller | N | Y | 2025-12-10 18:01:17.778 |
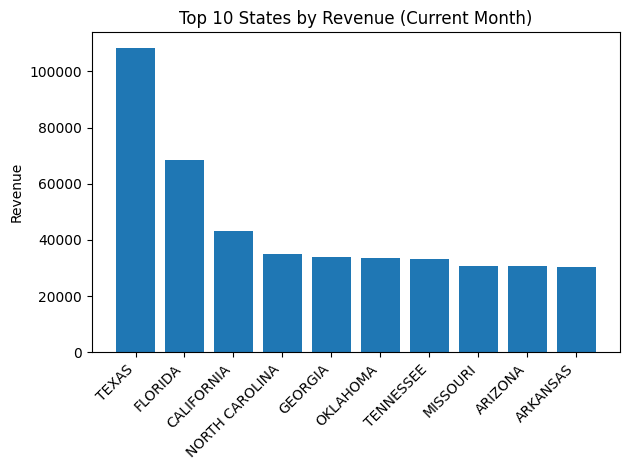
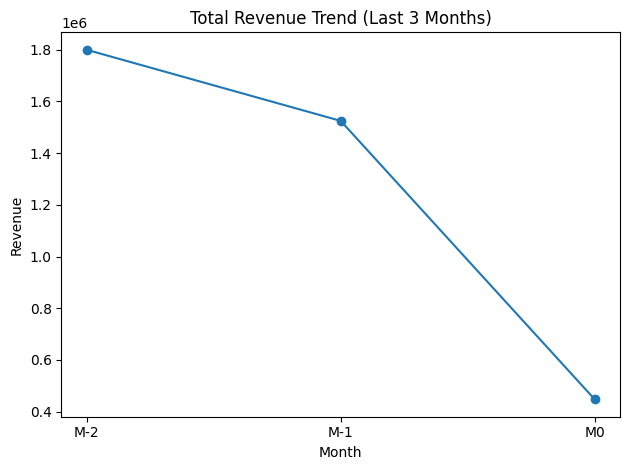
2. State-Level Sales Performance — Revenue & Units by Month (Last 3 Months, Pivoted)
- m0 = current month-to-date
- m1 = last full month
- m2 = month before last
| STATE_NAME | REVENUE_M0 | UNITS_M0 | REVENUE_M1 | UNITS_M1 | REVENUE_M2 | UNITS_M2 |
|---|---|---|---|---|---|---|
| TEXAS | 108493.24 | 14067.00 | 382852.90 | 50627.00 | 469630.29 | 61645.00 |
| FLORIDA | 68629.43 | 7697.00 | 225426.54 | 25365.00 | 260481.83 | 29189.00 |
| CALIFORNIA | 43055.10 | 4832.00 | 138696.78 | 15272.00 | 158651.67 | 17222.00 |
| NORTH CAROLINA | 35046.08 | 3946.00 | 117246.08 | 13084.00 | 134971.10 | 15133.00 |
| GEORGIA | 34031.37 | 3810.00 | 114702.32 | 12860.00 | 131354.86 | 14701.00 |
| OKLAHOMA | 33671.89 | 3759.00 | 116986.86 | 13069.00 | 144292.53 | 16223.00 |
| TENNESSEE | 33090.27 | 3697.00 | 112597.21 | 12564.00 | 130905.97 | 14657.00 |
| MISSOURI | 30723.65 | 3428.00 | 106469.00 | 11911.00 | 122698.17 | 13805.00 |
| ARIZONA | 30687.91 | 3447.00 | 106586.65 | 11914.00 | 121377.58 | 13650.00 |
| ARKANSAS | 30345.52 | 3384.00 | 103037.95 | 11496.00 | 125229.40 | 14004.00 |
| ALABAMA | 28619.89 | 3193.00 | 100616.12 | 11266.00 | 122075.87 | 13654.00 |
| ILLINOIS | 28106.80 | 3135.00 | 89197.52 | 9930.00 | 104287.26 | 11581.00 |
| PENNSYLVANIA | 27927.62 | 3160.00 | 92334.86 | 10380.00 | 105111.74 | 11846.00 |
| OHIO | 27369.86 | 3091.00 | 90594.78 | 10181.00 | 104625.38 | 11741.00 |
| WISCONSIN | 23954.17 | 2678.00 | 75798.90 | 8489.00 | 86722.63 | 9770.00 |
| VIRGINIA | 23851.43 | 2669.00 | 77417.50 | 8645.00 | 90033.32 | 10055.00 |
| COLORADO | 23828.25 | 2662.00 | 81107.68 | 9095.00 | 91840.09 | 10287.00 |
| INDIANA | 20705.70 | 2317.00 | 69647.56 | 7806.00 | 83106.79 | 9349.00 |
| LOUISIANA | 20392.61 | 2318.00 | 73762.53 | 8463.00 | 90047.68 | 10139.00 |
| WASHINGTON | 20368.10 | 2335.00 | 64573.82 | 7309.00 | 72120.19 | 8085.00 |
| SOUTH CAROLINA | 19396.55 | 2164.00 | 67320.88 | 7523.00 | 76781.63 | 8666.00 |
| NEW YORK | 18937.37 | 2121.00 | 60465.28 | 6776.00 | 70676.55 | 7907.00 |
| UTAH | 18464.03 | 2067.00 | 57197.89 | 6422.00 | 67279.31 | 7594.00 |
| MINNESOTA | 18049.28 | 2014.00 | 59476.29 | 6679.00 | 66528.46 | 7470.00 |
| KENTUCKY | 17879.29 | 1994.00 | 56803.84 | 6408.00 | 66640.47 | 7502.00 |
| KANSAS | 17733.50 | 1983.00 | 57504.55 | 6463.00 | 66336.44 | 7461.00 |
| MICHIGAN | 17433.66 | 1951.00 | 57387.28 | 6414.00 | 67165.80 | 7567.00 |
| IOWA | 16401.01 | 1831.00 | 52166.01 | 5834.00 | 62983.52 | 7064.00 |
| MISSISSIPPI | 14831.41 | 1654.00 | 49985.83 | 5604.00 | 62430.35 | 7022.00 |
| IDAHO | 14242.48 | 1591.00 | 46164.82 | 5160.00 | 49340.39 | 5507.00 |
| NEW MEXICO | 13063.56 | 1461.00 | 44655.02 | 5003.00 | 50164.77 | 5597.00 |
| NEBRASKA | 12782.25 | 1425.00 | 39801.58 | 4464.00 | 44672.87 | 4983.00 |
| OREGON | 12449.42 | 1394.00 | 37031.77 | 4173.00 | 43800.30 | 4952.00 |
| NEVADA | 12098.53 | 1349.00 | 35267.84 | 3949.00 | 40198.89 | 4496.00 |
| MASSACHUSETTS | 10431.64 | 1163.00 | 31120.55 | 3475.00 | 35297.69 | 3949.00 |
| MONTANA | 8900.89 | 1023.00 | 28832.96 | 3320.00 | 30019.28 | 3475.00 |
| SOUTH DAKOTA | 8812.72 | 992.00 | 27525.09 | 3100.00 | 30770.74 | 3453.00 |
| WYOMING | 8566.35 | 955.00 | 29746.57 | 3324.00 | 32591.58 | 3672.00 |
| NEW JERSEY | 8347.24 | 934.00 | 26732.68 | 2993.00 | 29276.72 | 3274.00 |
| MARYLAND | 7597.59 | 847.00 | 26518.03 | 2958.00 | 29719.93 | 3354.00 |
| WEST VIRGINIA | 7489.95 | 835.00 | 24584.32 | 2762.00 | 28917.89 | 3241.00 |
| NEW HAMPSHIRE | 7267.56 | 814.00 | 23756.26 | 2660.00 | 28145.27 | 3142.00 |
| NORTH DAKOTA | 6766.41 | 757.00 | 22527.61 | 2589.00 | 25442.46 | 2927.00 |
| MAINE | 6382.70 | 712.00 | 19847.76 | 2214.00 | 21763.40 | 2428.00 |
| CONNECTICUT | 4984.56 | 563.00 | 15759.06 | 1791.00 | 18329.70 | 2105.00 |
| HAWAII | 3775.85 | 330.00 | 11944.59 | 1042.00 | 13530.98 | 1180.00 |
| ALASKA | 3647.64 | 339.00 | 13250.98 | 1234.00 | 13565.69 | 1262.00 |
| RHODE ISLAND | 2296.32 | 256.00 | 6413.55 | 715.00 | 7211.88 | 804.00 |
| DELAWARE | 1480.05 | 165.00 | 5435.82 | 606.00 | 5615.22 | 626.00 |
| VERMONT | 1228.89 | 137.00 | 3919.89 | 437.00 | 4574.70 | 510.00 |
| DISTRICT OF COLUMBIA | 251.16 | 28.00 | 1049.49 | 117.00 | 1237.86 | 138.00 |
Deeper Business Analysis
🟢 State Concentration
- Top 5 states (TX, FL, CA, NC, GA) account for a very large share of total revenue.
- Smaller states show consistent but low velocity, suggesting distribution exists but velocity per store is low.
Implication
- Growth upside likely comes more from deepening velocity in top states than expanding footprint into new ones.
🔴 Under-penetrated Opportunity States
States with decent size but lower relative revenue:
- New York
- Washington
- Massachusetts
- New Jersey
Analysis - Target
1. Target Monthly Sales (2025)
| Month | Revenue | Units |
|---|---|---|
| Oct 2025 | $4.58M | 397K |
| Nov 2025 | $4.07M | 355K |
| Dec 2025 (MTD) | $1.16M | 101K |
-
Strong Q4 Momentum
-
October and November show very strong Target performance:**
-
~$4–4.6M per month
-
~350–400K units
-
This establishes a solid Q4 baseline for LMNT at Target.
Takeaway:
- Target is a meaningful revenue channel for LMNT, with consistent multi-million-dollar monthly volume.
Revenue down ~11% MoM from Oct → Nov
- Units down in the same range
- This suggests, slight seasonality or promo timing shift.
2. Reporting Channel Split (Target, 2025)
October 2025
- Store (STR): $3.67M | 323K units (~80% of revenue)
- Online / Fulfilled (FF): $0.88M | 72K units (~19%)
- FC: ~$28K | ~2K units (<1%)
November 2025
- Store (STR): $3.27M | 291K units (~80%)
- FF: $0.77M | 61K units (~19%)
- FC: ~$28K | ~2K units (<1%)
December 2025 (MTD)
- Store (STR): $0.92M | 81K units
- FF: $0.24M | 19K units
- FC: ~$11K | <1K units
Key Takeaways:
- Target Sales Are Strongly Store-Led
- ~80% of LMNT revenue consistently comes from in-store purchases
- This mix is remarkably stable across months